
rics.performance#
Performance testing utility.
Functions
|
Deprecated alias of |
|
Deprecated alias of |
|
Get a summarized view of the best run results for each candidate/data pair. |
|
Plot the results of a performance test. |
|
Create a |
|
Compare candidates against a baseline candidate. |
|
Run performance tests for multiple candidate methods on collections of test data. |
|
Create a DataFrame from performance run output, adding derived values. |
Classes
|
Performance testing implementation for multiple candidates and data sets. |
|
Data type for a skip_if predicate. |
|
A fitted stratification: |
- class MultiCaseTimer(candidate_method: Mapping[str, Callable[[DataType], Any]] | Collection[Callable[[DataType], Any]] | Callable[[DataType], Any], test_data: Mapping[Any, DataType] | Collection[DataType] | Callable[[Unpack[Ts]], DataType], *, case_args: Collection[tuple[Unpack[Ts]]] | None = None, kwargs: Any | None = None, setup: Callable[[DataType], DataType] | None = None, warmup: int = 0, logger: Logger | str | None | Literal[False] = None)[source]#
Bases:
Generic[DataType,Unpack[Ts]]Performance testing implementation for multiple candidates and data sets.
- Test data:
Typically a dict
{label: data}to evaluate candidates.Other collections are converted to
dictusingprocess_test_data(). String label will then be based on sample data.Labels may also be
tuple. This may then be used to plot different categories of data in different facets; see theplot_run()function with the names argument.For non-dict inputs, string labels will be generated automatically.
If test_data is
callable(), test data will be generated from the case_args.
Data access time is not measured by the
runmethod.- Timing model:
run()derives a single iterationnumberper candidate (shared across all test-data variants, so candidates stay comparable), calibrated so each repetition takes abouttime_per_candidate. The total runtime is therefore approximatelyrepeat * time_per_candidate * n_candidates: adding more test-data variants does not increase it, it divides the per-candidate budget across the variants. Passnumberexplicitly to bypass calibration.When variants differ wildly in cost (e.g. tiny and huge inputs in one run), the shared
numberis driven by the slowest variants, leaving the fast ones under-sampled and noisy. Stratification (below) fixes this.- Stratification:
The first
run(stratify="auto")probes once and caches the resultingStrataon the instance, so later runs reuse it. Usecompute_strata()to derive a grouping without side effects – to inspect what"auto"chose or share it across timers – orfit_strata()to derive and cache it (e.g. with a tuned probe). Either result, or any mapping, can be passed back asrun(stratify=...).
- Parameters:
candidate_method – A dict
{label: function}. Alternatively, you may pass a collection of functions or a single function.test_data – A
{label: data}to evaluate candidates on. You may also pass a list of data, which will be converted to a dict as above. Data may also be generated by passing a callable.case_args – Collection of positional arguments for a test_data callable.
kwargs – Shared keyword arguments for a test_data callable.
setup – A callable
(data) -> datainvoked – not measured – before each timed repetition to produce a fresh input (mirrorstimeit.Timer’ssetup). Use for candidates that mutate their input, or to reset shared state (e.g. caches) between repetitions.warmup – Number of untimed calls per candidate/data pair before timing begins (warms caches/JIT/imports).
logger – Logger instance to use.
- Raises:
TypeError – If args or kwargs are set when test_data is not a callable.
ValueError – If args is empty and test_data is a callable.
- LOGGER: ClassVar[Logger | LoggerAdapter[Any]] = <Logger rics.performance (WARNING)>#
Class logger instance.
- classmethod process_candidates(candidates: Mapping[str, Callable[[DataType], Any]] | Collection[Callable[[DataType], Any]] | Callable[[DataType], Any]) dict[str, Callable[[DataType], Any]][source]#
Convert input candidates to the internal format.
- classmethod process_test_data(test_data: Mapping[Any, DataType] | Collection[DataType]) dict[Hashable, DataType][source]#
Convert input test data to the internal format.
- derive_names() list[str][source]#
Derive names argument.
- Raises:
TypeError – If test_data is not callable.
- compute_strata(stratify: Callable[[Hashable], Hashable] | Mapping[Any, Iterable[Hashable]] | int | Literal['full', 'auto'] | None = 'auto', *, min_probe_time: float = 0.001, skip_if: Callable[[SkipIfParams[DataType, Unpack[Ts]]], bool] | None = None) Strata[source]#
Derive a
Stratagrouping for this timer’s candidates and data, without side effects.- Valid
stratifyinput types: A callable
(data_label) -> stratum_key.An
intcase_argslevel (group bycase_args[level]).Literal
"full"– one stratum per variant."auto"– derive a singlecase_argslevel automatically; see below.A precomputed
{stratum_key: {data_label, ...}}mapping.
- Automatic stratification:
For
stratify="auto"a quick timing probe measures each variant’s cost, then the singlecase_argslevel whose strata best cluster variants of comparable cost is chosen – formally, the level minimizing the worst within-stratum cost ratio (usually the input size/cost dimension).The probe is deliberately cheap; increase min_probe_time to increase accuracy.
Use
fit_strata()to cache the result for laterrun(stratify="auto")calls, or set theMultiCaseTimer.strataproperty.- Parameters:
stratify – Any
StratifyArg. AStratais returned unchanged; any other mapping is wrapped (and validated to cover the data).min_probe_time – Per
(candidate, variant)budget for the"auto"probe; larger is less noisy but slower. Ignored unless stratify is"auto".skip_if – Filter applied while probing (
"auto"only); recorded on the result.
- Returns:
The grouping.
- Valid
- property strata: Strata#
Cached
Stratainstance; seefit_strata().
- fit_strata(stratify: Callable[[Hashable], Hashable] | Mapping[Any, Iterable[Hashable]] | int | Literal['full', 'auto'] | None = 'auto', *, min_probe_time: float = 0.001, skip_if: Callable[[SkipIfParams[DataType, Unpack[Ts]]], bool] | None = None) Self[source]#
compute_strata(), then cache the result so laterrun(stratify="auto")calls reuse it.This is how
run()memoizes its first implicit"auto"fit; call it yourself to control the probe (min_probe_time) or to pin a grouping before running. Any previously cached grouping is overwritten silently. Seecompute_strata()for the arguments and how"auto"is derived.Use
stratato access the cached instance.- Returns:
Self, for chained assignment.
- run(*, time_per_candidate: float = 6.0, repeat: int = 5, number: int | None = None, stratify: Callable[[Hashable], Hashable] | Mapping[Any, Iterable[Hashable]] | int | Literal['full', 'auto'] | None = None, skip_if: Callable[[SkipIfParams[DataType, Unpack[Ts]]], bool] | None = None, progress: bool = False) dict[str, dict[Hashable, list[float]]][source]#
Run for all cases.
- Parameters:
time_per_candidate – Minimum runtime per repetition and candidate label. When stratify is set this budget applies per
(candidate, stratum)instead, so total runtime scales with the number of strata. Ignored if number is set.repeat – Number of times to repeat for all candidates per data label.
number – Number of times to execute each candidate, per repetition.
stratify – Groups variants of comparable cost so that
numberis calibrated once per(candidate, stratum)instead of once per candidate function. Using"auto"implicitly callsfit_strata()the first time. Set toNoneto disable.skip_if – A callable
(skip_if) -> bool; see theparamstype.progress – If
True, display progress. Usestqdmon a TTY and falls back to periodic logging otherwise (sotqdmis optional).
Examples
If repeat=5 and time_per_candidate=3 for an instance with 2 candidates, the total runtime will be approximately
5 * 3 * 2 = 30seconds – regardless of how many test-data variants are used (unless stratify is set).- Returns:
A dict run_results on the form
{candidate_label: {data_label: [runtime, ...]}}.
Notes
Calibration is inaccurate for candidates where a single call already exceeds time_per_candidate; the derived
numberthen bottoms out at 1.
See also
The
timeit.Timerclass which this implementation depends on.
- class SkipIfParams(candidate: Callable[[DataType], Any], candidate_label: str, data: DataType, data_label: Hashable | tuple[Unpack[Ts]], est_time: float | None, results_so_far: dict[str, dict[Hashable, list[float]]])[source]#
Bases:
Generic[DataType,Unpack[Ts]]Data type for a skip_if predicate.
- class Strata(groups: Mapping[Hashable, Iterable[Hashable]], *, source: str, skip_if: Callable[[SkipIfParams[Any, Unpack[tuple[Any, ...]]]], bool] | None = None, costs: dict[Hashable, float] | None = None)[source]#
Bases:
Mapping[Hashable,frozenset[Hashable]]A fitted stratification:
{stratum_key: {data_label, ...}}, plus a record of how it was derived.Behaves as a read-only
Mappingofstratum_keyto the labels in that stratum. Pass an instance toMultiCaseTimer.run()(or get one fromMultiCaseTimer.compute_strata()) to reuse a grouping without re-deriving it – handy to avoid repeating the"auto"cost probe across runs, or to inspect what"auto"chose.- source#
How the grouping was derived, e.g.
"auto(level=0)","level=1","full","callable"or"none"(a single shared stratum).
- skip_if#
The skip_if filter in effect when the grouping was fit (
Noneif unfiltered). Recorded soMultiCaseTimer.run()can warn when the grouping is reused under a different filter.
- costs#
Per-label costs measured by the
"auto"probe, orNonefor other modes.
- format_perf_counter(start: float, end: float | None = None) str[source]#
Deprecated alias of
rics.strings.format_perf_counter().
- format_seconds(t: float, *, allow_negative: bool = False) str[source]#
Deprecated alias of
rics.strings.format_seconds().
- get_best(run_results: dict[str, dict[Hashable, list[float]]] | DataFrame, per_candidate: bool = False, names: Iterable[str] = ()) DataFrame[source]#
Get a summarized view of the best run results for each candidate/data pair.
- Parameters:
run_results – Output of
rics.performance.MultiCaseTimer.run().per_candidate – If
True, show the best times for all candidate/data pairs. Otherwise, just show the best candidate per data label.names – Data label columns to show. Use single ‘Test data’ column if not given.
- Returns:
The best (lowest) times for each candidate/data pair.
- legacy_plot_run(run_results: dict[str, dict[Hashable, list[float]]] | DataFrame, x: Literal['candidate', 'data'] | None = None, unit: Literal['s', 'ms', 'μs', 'us', 'ns'] | None = None, **kwargs: Any) None[source]#
Plot the results of a performance test.
This is a legacy method that does not support facets.
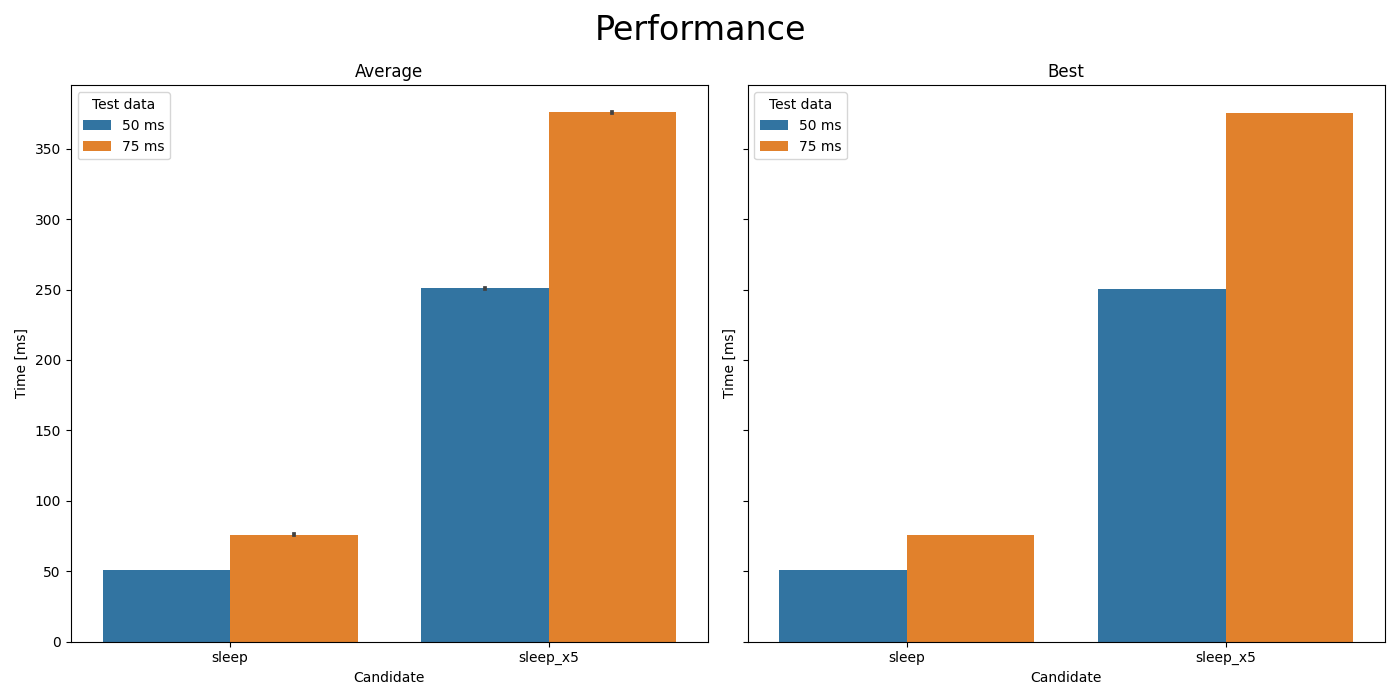
Comparison of
time.sleep(t)andtime.sleep(5*t).#- Parameters:
run_results – Output of
rics.performance.MultiCaseTimer.run().x – The value to plot on the X-axis, using the other to determine hue. Default=derive.
unit – Time unit to plot on the Y-axis. Default=derive.
**kwargs – Keyword arguments for
seaborn.barplot().
- Raises:
ModuleNotFoundError – If Seaborn isn’t installed.
TypeError – For unknown unit arguments.
- plot_run(run_results: dict[str, dict[Hashable, list[float]]] | DataFrame, *, x: str | None = None, hue: str | None = None, horizontal: bool = False, unit: Literal['s', 'ms', 'μs', 'us', 'ns'] | None = None, kind: Literal['bar', 'box', 'boxen', 'point', 'strip', 'swarm', 'violin'] = 'bar', names: Iterable[str] = (), relative_to: str | None = None, agg: Aggregation = 'min', **kwargs: Any) seaborn.FacetGrid[source]#
Create a
seaborn.catplot()from run results.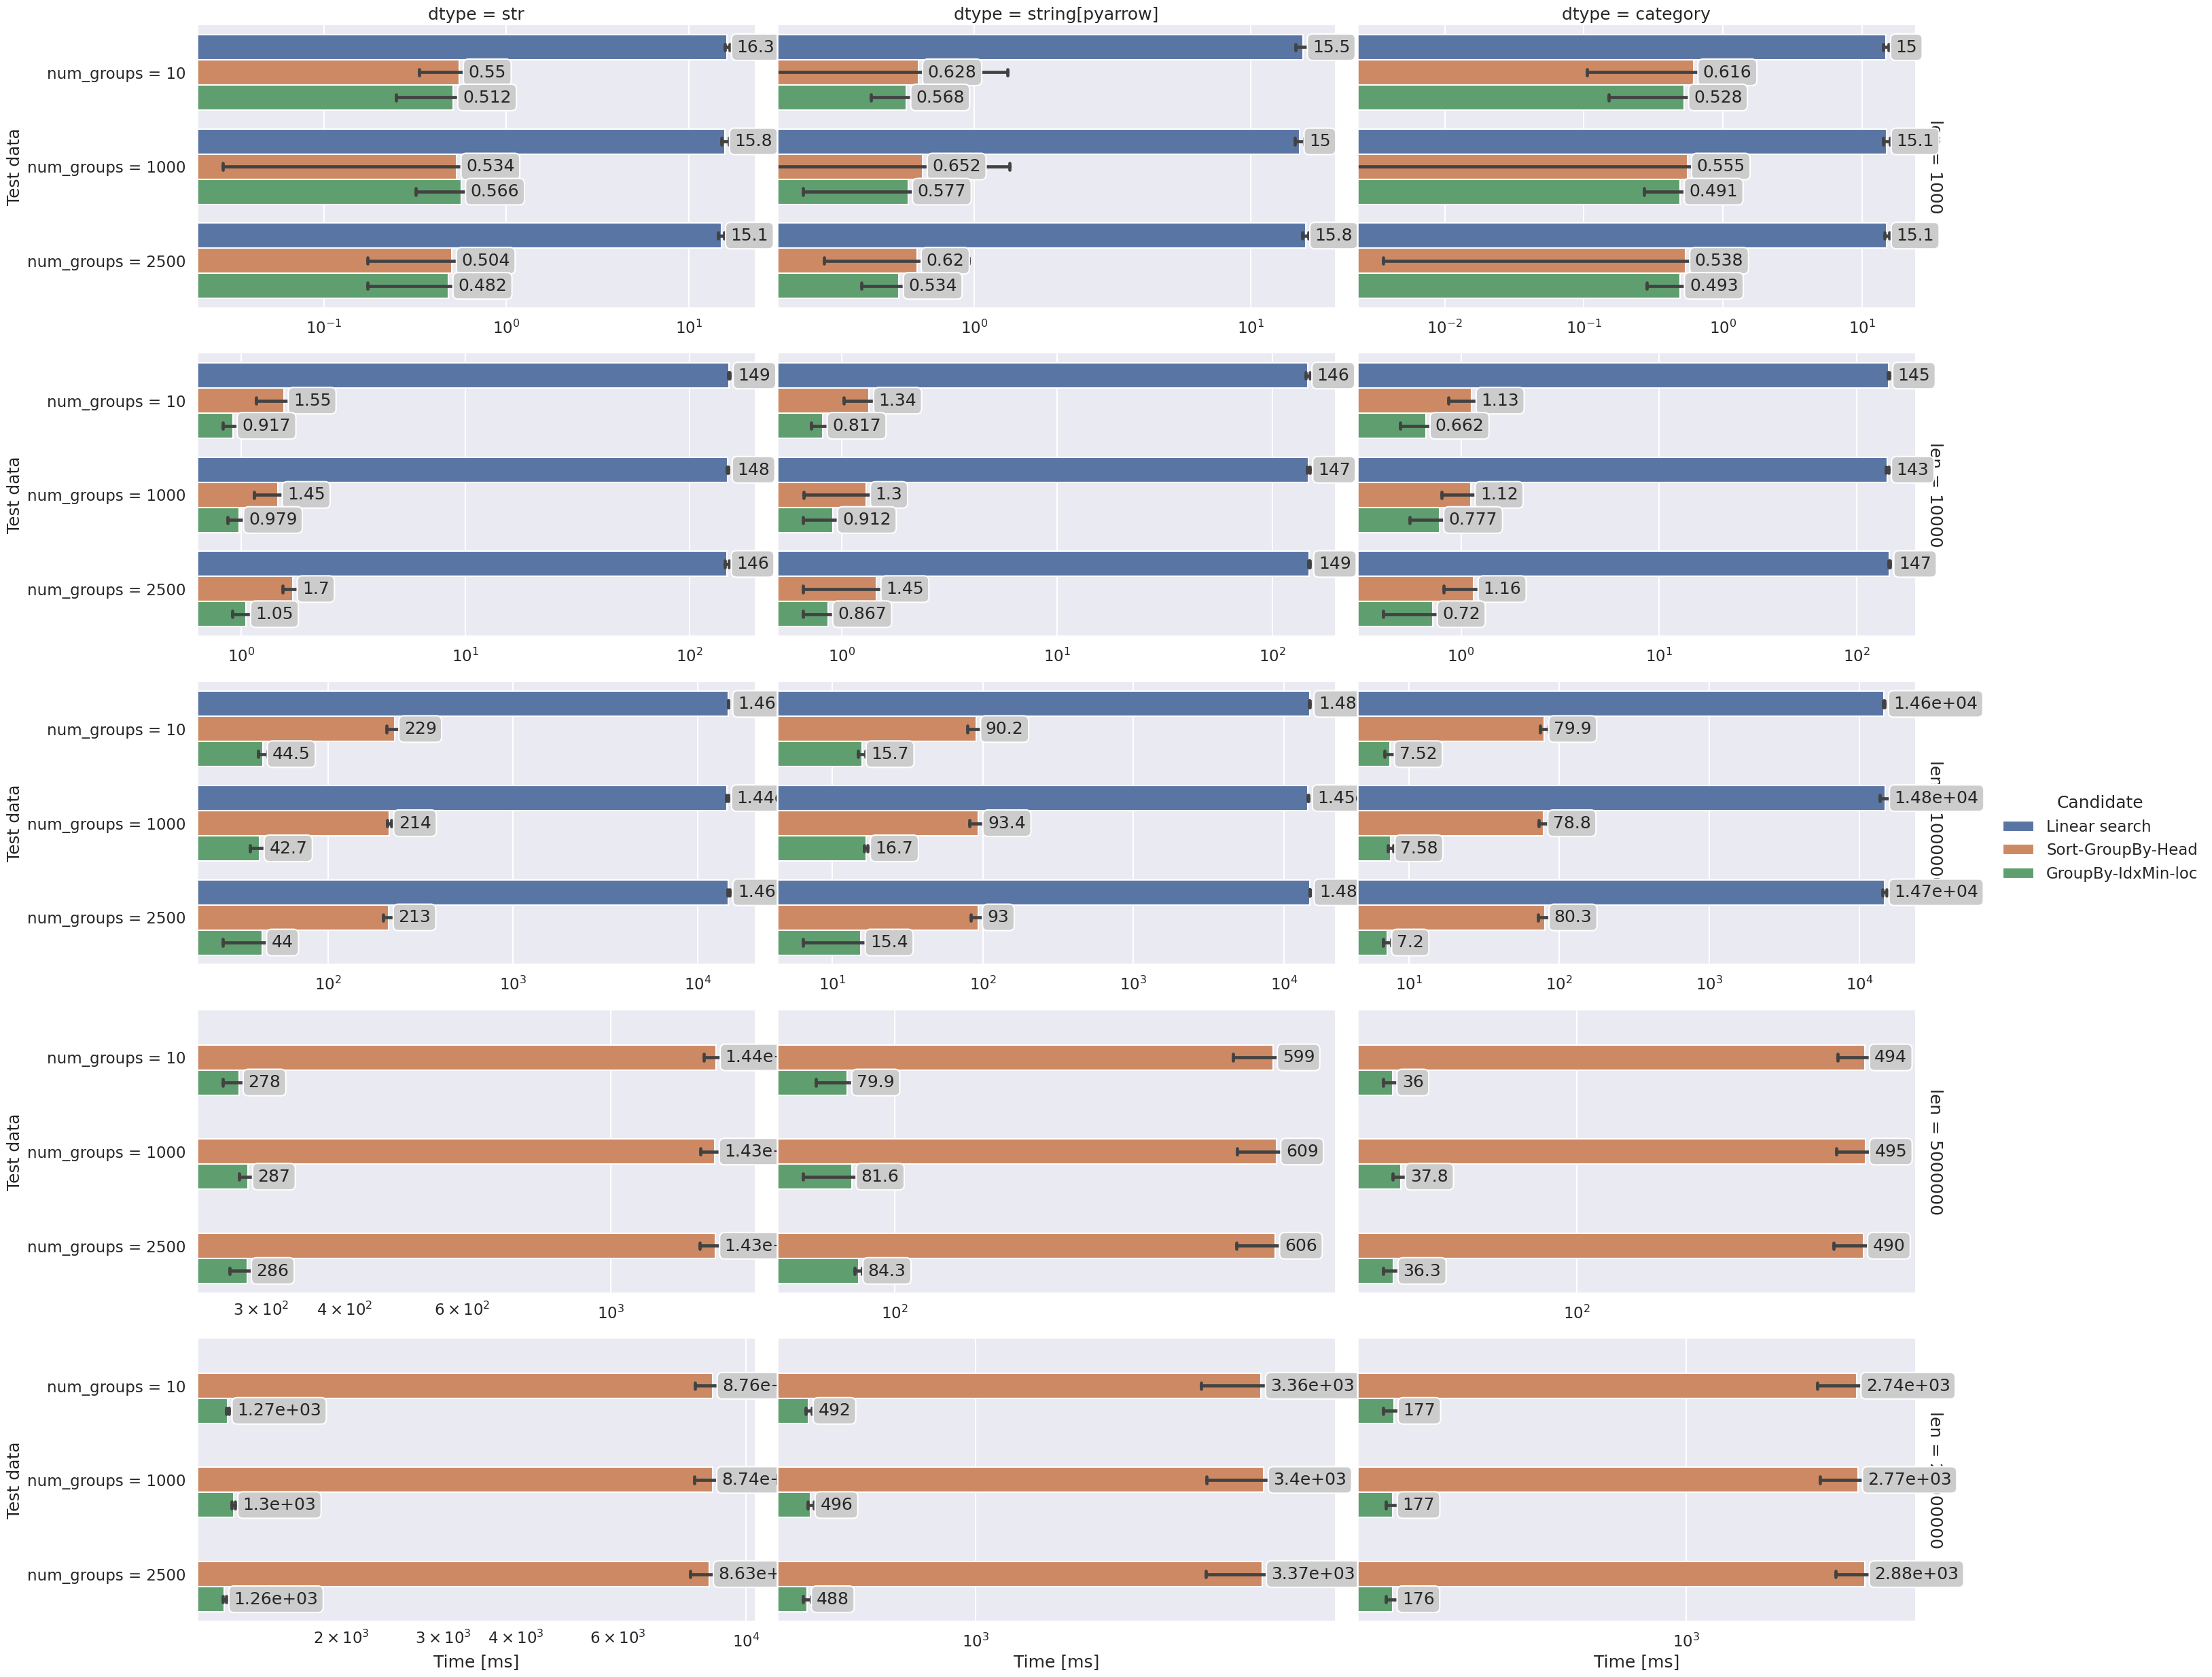
Comparison of best-per-group selection functions (from the examples page).#
- The names argument:
Names may be passed in combination with
rowand/orcolarguments to add facets to theseaborn.catplot(). If given, the keys in the test data must be of typetuplewith the same length as names. For example, if your test data looks like this:test_data = { ("+", 2, 5): +(2**5), ("+", 9, 5): +(9**5), ("+", 10, 5): +(10**5), ("-", 10, 3): -(10**3), ("-", 5, 3): -(5**3), }
you may pass
plot_run(
    run_results = ...,
    names=["sign", "base", "exponent"],
    col="sign",
    row="exponent",
)
to plot each sign/exponent in a separate facet, comparing only the exponents in the subplots.
- Parameters:
run_results – Output of
MultiCaseTimer.run().x – X-axis quantity:
'candidate','data', or one of names (a test-data dimension). If omitted, defaults to the complement of hue (or the higher-cardinality of candidate/data).hue – Hue quantity:
'candidate','data', or one of names. If omitted, defaults to the complement of x (or the candidate when x is a named dimension).horizontal – If
True, plot the metric on the X-axis instead. The x becomes the new Y-axis quantity.unit – Y-axis time
Unit. Not allowed in relative_to mode.kind – The
Kindof plot to draw.names – Test data level names.
relative_to – If given, plot the speedup of each candidate relative to this baseline candidate (see
relative_to()) instead of absolute timings. The Y-axis becomes a dimensionlessspeedupand a reference line is drawn at1.0. The baseline itself (always1.0) is represented by the reference line and omitted from the bars.agg – How to summarize the repeated timings in relative_to mode; one of
'min','median','mean'.**kwargs – Keyword arguments for
seaborn.catplot()(e.g.col,row,col_wrap).
- Returns:
- Raises:
ModuleNotFoundError – If Seaborn isn’t installed.
TypeError – For unknown unit arguments.
ValueError – For unknown x/hue arguments, or unit combined with relative_to.
- relative_to(run_results: dict[str, dict[Hashable, list[float]]] | DataFrame, baseline: str, *, names: Iterable[str] = (), agg: Literal['min', 'median', 'mean'] = 'min') DataFrame[source]#
Compare candidates against a baseline candidate.
Reduces the repeated timings to one number per candidate/data pair (using agg) and expresses each candidate relative to baseline on the same data.
- Parameters:
run_results – Output of
MultiCaseTimer.run()(or ato_dataframe()frame).baseline – Label of the candidate to compare against.
names – Level names for tuple keys in the data (creates new columns). See
plot_run()for details.agg – How to summarize the repeated timings; one of
'min'(default),'median','mean'.
- Returns:
A tidy frame with columns
['candidate', 'data', *names, 'seconds', 'baseline_seconds', 'speedup']wherespeedup = baseline_seconds / seconds(> 1means faster than the baseline). The geometric-mean speedup per candidate is available inframe.attrs['geomean'].- Raises:
Notes
baseline must have a timing for every data label that appears for the other candidates. Data labels missing from the baseline – e.g. filtered out by
skip_if– produceNaNspeedup for the affected rows, and aNaNentry for that candidate inattrs['geomean'].
- run_multivariate_test(candidate_method: Mapping[str, Callable[[DataType], Any]] | Collection[Callable[[DataType], Any]] | Callable[[DataType], Any], test_data: Mapping[Any, DataType] | Collection[DataType] | Callable[[Unpack[Ts]], DataType], *, time_per_candidate: float = 6.0, repeat: int = 5, plot: bool = True, show: bool = True, names: Iterable[str] | None = (), progress: bool = False, setup: Callable[[DataType], DataType] | None = None, warmup: int = 0, stratify: Callable[[Hashable], Hashable] | Mapping[Any, Iterable[Hashable]] | int | Literal['full', 'auto'] | None = None, case_args: Collection[tuple[Unpack[Ts]]] | None = None, kwargs: Any | None = None, **plot_kwargs: Any) DataFrame[source]#
Run performance tests for multiple candidate methods on collections of test data.
This is a convenience method which combines
MultiCaseTimer.run(),to_dataframe()and – if plotting is enabled –plot_run(). For full functionally these methods should be use directly.- Parameters:
candidate_method – A dict
{label: function}. Alternatively, you may pass a collection of functions or a single function.test_data – A
{label: data}to evaluate candidates on. You may also pass a list of data, which will be converted to a dict as above. Data may also be generated by passing a callable.time_per_candidate – Minimum runtime per repetition and candidate label. When stratify is set this budget applies per
(candidate, stratum)instead, so total runtime scales with the number of strata.repeat – Number of times to repeat for all candidates per data label.
plot – If
True, plot a figure usingplot_run().show – If
True, attempt to display the figure. Ignored whenplot=False.names – Level names for tuple keys in the data (creates new columns). See
plot_run()for details. Set toNoneto disable derived names when test_data is callable.progress – If
True, display progress. Usestqdmon a TTY and falls back to periodic logging otherwise (sotqdmis optional).setup – A callable
(data) -> datainvoked – not measured – before each timed repetition to produce a fresh input (mirrorstimeit.Timer’ssetup). Use for candidates that mutate their input, or to reset shared state (e.g. caches) between repetitions.warmup – Number of untimed calls per candidate/data pair before timing begins (warms caches/JIT/imports).
stratify – Groups variants of comparable cost so that the iteration count is calibrated once per
(candidate, stratum)instead of once per candidate function. Using"auto"implicitly callsfit_strata()the first time. Set toNoneto disable.case_args – Collection of positional arguments for a test_data callable.
kwargs – Shared keyword arguments for a test_data callable.
**plot_kwargs – See
plot_run()for details. Ignored ifplot=False.
- Returns:
A long-form DataFrame of results.
- Raises:
RuntimeError – If Seaborn isn’t installed and
plot=True.TypeError – If case_args or kwargs are set when test_data is not a callable.
ValueError – If case_args is empty and test_data is a callable.
See also
The
plot_run()andget_best()functions.
- to_dataframe(run_results: dict[str, dict[Hashable, list[float]]], names: Iterable[str] = (), *, tidy: bool = False) DataFrame[source]#
Create a DataFrame from performance run output, adding derived values.
- Parameters:
run_results – Output of
MultiCaseTimer.run().names – Level names for tuple keys in the data (creates new columns). See
plot_run()for details.tidy – If
True, return a minimal analysis-friendly frame with lowercase columns['candidate', 'data', *names, 'run', 'seconds']and no presentation columns (unit conversions,'Times min'etc.). The default (False) returns the plotting-oriented frame consumed byplot_run(), which mixes data with presentation (multiple'Time [<unit>]'columns).
- Returns:
The run_result input as a
pandas.DataFrame.- Raises:
TypeError – If names is not compatible with the given run_results.
Modules
Multivariate performance testing from the command line. |
|
Types used by the plotting framework. |
|
Types used by the framework. |