rics.performance#
Performance testing utility.
Functions
|
Run performance tests for multiple candidate methods on collections of test data. |
|
Format performance counter output. |
Format performance counter output. |
|
|
Plot the results of a performance test. |
|
Create a DataFrame from performance run output, adding derived values. |
|
Get a summarized view of the best run results for each candidate/data pair. |
Classes
|
Performance testing implementation for multiple candidates and data sets. |
- class MultiCaseTimer(candidate_method: Callable[[Any], None] | Collection[Callable[[Any], None]] | Mapping[str, Callable[[Any], None]], test_data: Any | Mapping[str, Any])[source]#
Bases:
objectPerformance testing implementation for multiple candidates and data sets.
- Parameters:
candidate_method – A single method, collection of method or a dict {label: function} of candidates.
test_data – A single datum or a dict
{label: data}to evaluate candidates on.
- run(time_per_candidate: float = 6.0, repeat: int = 5, number: int | None = None) Dict[str, Dict[str, List[float]]][source]#
Run for all cases.
Note that the test case variant data isn’t included in the expected runtime computation, so increasing the amount of test data variants (at initialization) will reduce the amount of times each candidate is evaluated.
- Parameters:
time_per_candidate – Desired runtime for each repetition per candidate label. Ignored if number is set.
repeat – Number of times to repeat for all candidates per data label.
number – Number of times to execute each test case, per repetition. Compute based on per_case_time_allocation if
None.
Examples
If repeat=5 and time_per_candidate=3 for an instance with and 2 candidates, the total runtime will be approximately
5 * 3 * 2 = 30seconds.- Returns:
A dict run_results on the form
{candidate_label: {data_label: [runtime..]}}.- Raises:
ValueError – If the total expected runtime exceeds max_expected_runtime.
Notes
Precomputed runtime is inaccurate for functions where a single call are longer than time_per_candidate.
See also
The
timeit.Timerclass which this implementation depends on.
- run_multivariate_test(candidate_method: Callable[[Any], None] | Collection[Callable[[Any], None]] | Mapping[str, Callable[[Any], None]], test_data: Any | Mapping[str, Any], time_per_candidate: float = 6.0, plot: bool = True, **figure_kwargs: Any) DataFrame[source]#
Run performance tests for multiple candidate methods on collections of test data.
This is a convenience method which combines
MultiCaseTimer.run(),to_dataframe()and – if plotting is enabled –plot_run(). For full functionally these methods should be use directly.- Parameters:
candidate_method – Candidate methods to evaluate.
test_data – Test data to evaluate.
time_per_candidate – Desired runtime for each repetition per candidate label.
plot – If
True, plot a figure usingplot_run().**figure_kwargs – Keyword arguments for the barplot. Ignored if
plot=False.
- Returns:
A long-format DataFrame of results.
- Raises:
ModuleNotFoundError – If Seaborn isn’t installed and
plot=True.
- format_perf_counter(start: float, end: float | None = None) str[source]#
Format performance counter output.
This function formats performance counter output based on the time elapsed. For
t < 120 sec, accuracy is increased whereas for durations above one minute a more user-friendly formatting is used.- Parameters:
start – Start time.
end – End time. Set to now if not given.
- Returns:
A formatted performance counter time.
Examples
>>> from rics.performance import format_perf_counter
>>> format_perf_counter(0, 3131)  # 3131 seconds is about 52 minutes.
'0:52:11'
>>> format_perf_counter(0, 0.154)
'0.154 sec'
See also
- format_seconds(t: float) str[source]#
Format performance counter output.
This function formats performance counter output based on the time elapsed. For
t < 120 sec, accuracy is increased whereas for durations above one minute a more user-friendly formatting is used.- Parameters:
t – Time in seconds.
- Returns:
A formatted performance counter time.
- plot_run(run_results: Dict[str, Dict[str, List[float]]] | DataFrame, x: Literal['candidate', 'data'] | None = None, unit: Literal['s', 'ms', 'μs', 'us'] = 'ms', **figure_kwargs: Any) None[source]#
Plot the results of a performance test.
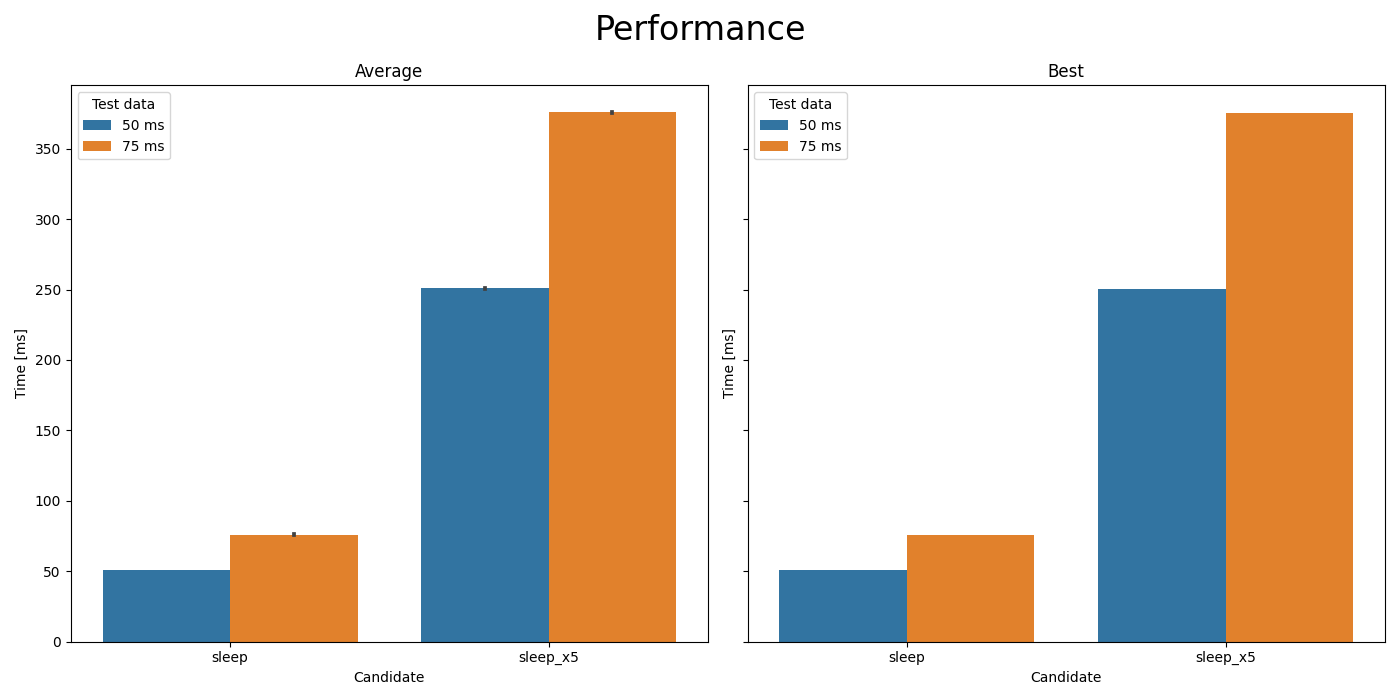
Comparison of
time.sleep(t)andtime.sleep(5*t).#- Parameters:
run_results – Output of
rics.performance.MultiCaseTimer.run().x – The value to plot on the X-axis. Default=derive.
unit – Time unit to plot on the Y-axis.
**figure_kwargs – Keyword arguments for the barplot.
- Raises:
ModuleNotFoundError – If Seaborn isn’t installed.
TypeError – For unknown unit arguments.
- to_dataframe(run_results: Dict[str, Dict[str, List[float]]]) DataFrame[source]#
Create a DataFrame from performance run output, adding derived values.
- Parameters:
run_results – Output from
rics.performance.MultiCaseTimer.run().- Returns:
The run_result input wrapped in a DataFrame.
- get_best(run_results: Dict[str, Dict[str, List[float]]] | DataFrame, per_candidate: bool = False) DataFrame[source]#
Get a summarized view of the best run results for each candidate/data pair.
- Parameters:
run_results – Output of
rics.performance.MultiCaseTimer.run().per_candidate – If
True, show the best times for all candidate/data pairs. Otherwise, just show the best candidate per data label.
- Returns:
The best (lowest) times for each candidate/data pair.
Modules
Multivariate performance testing from the command line. |