rics.performance#
Performance testing utility.
Functions
|
Deprecated alias of |
|
Deprecated alias of |
|
Get a summarized view of the best run results for each candidate/data pair. |
|
Plot the results of a performance test. |
|
Create a |
|
Run performance tests for multiple candidate methods on collections of test data. |
|
Create a DataFrame from performance run output, adding derived values. |
Classes
|
Performance testing implementation for multiple candidates and data sets. |
|
Data type for a skip_if predicate. |
- class MultiCaseTimer(candidate_method: Mapping[str, Callable[[DataType], Any]] | Collection[Callable[[DataType], Any]] | Callable[[DataType], Any], test_data: Mapping[Any, DataType] | Collection[DataType] | Callable[[Unpack[Ts]], DataType], *, case_args: Collection[tuple[Unpack[Ts]]] | None = None, kwargs: Any | None = None)#
Bases:
Generic[DataType,Unpack[Ts]]Performance testing implementation for multiple candidates and data sets.
- Test data:
Typically a dict
{label: data}to evaluate candidates.Other collections are converted to
dictusingprocess_test_data(). String label will then be based on sample data.Labels may also be
tuple. This may then be used to plot different categories of data in different facets; see theplot_run()function with the names argument.For non-dict inputs, string labels will be generated automatically.
If test_data is
callable(), test data will be generated from the case_args.
Data access time is not measured by the
runmethod.
- Parameters:
candidate_method – A dict
{label: function}. Alternatively, you may pass a collection of functions or a single function.test_data – A
{label: data}to evaluate candidates on. You may also pass a list of data, which will be converted to a dict as above. Data may also be generated by passing a callable.case_args – These are positional arguments for the test_data callable.
kwargs – Shared keyword arguments for the test_data callable.
- Raises:
TypeError – If args or kwargs are set when test_data is not a callable.
ValueError – If args is empty and test_data is a callable.
- LOGGER: ClassVar[Logger | LoggerAdapter[Any]] = <Logger rics.performance (WARNING)>#
- classmethod process_candidates(candidates: Mapping[str, Callable[[DataType], Any]] | Collection[Callable[[DataType], Any]] | Callable[[DataType], Any]) dict[str, Callable[[DataType], Any]]#
Convert input candidates to the internal format.
- classmethod process_test_data(test_data: Mapping[Any, DataType] | Collection[DataType]) dict[Hashable, DataType]#
Convert input test data to the internal format.
- run(*, time_per_candidate: float = 6.0, repeat: int = 5, number: int | None = None, skip_if: Callable[[SkipIfParams[DataType, Unpack[Ts]]], bool] | None = None, progress: bool = False) dict[str, dict[Hashable, list[float]]]#
Run for all cases.
Note that the test case variant data isn’t included in the expected runtime computation, so increasing the amount of test data variants (at initialization) will reduce the amount of times each candidate is evaluated.
- Parameters:
time_per_candidate – Minimum runtime per repetition and candidate label. Ignored if number is set.
repeat – Number of times to repeat for all candidates per data label.
number – Number of times to execute each candidate, per repetition.
skip_if – A callable
(skip_if) -> bool; see theparamstype.progress – If
True, display a progress bar. Requirestqdm.
Examples
If repeat=5 and time_per_candidate=3 for an instance with and 2 candidates, the total runtime will be approximately
5 * 3 * 2 = 30seconds.- Returns:
A dict run_results on the form
{candidate_label: {data_label: [runtime, ...]}}.- Raises:
ValueError – If the total expected runtime exceeds max_expected_runtime.
Notes
Precomputed runtime is inaccurate for functions where a single call are longer than time_per_candidate.
See also
The
timeit.Timerclass which this implementation depends on.
- class SkipIfParams(candidate: Callable[[DataType], Any], candidate_label: str, data: DataType, data_label: Hashable | tuple[Unpack[Ts]], est_time: float | None, results_so_far: dict[str, dict[Hashable, list[float]]])#
Bases:
Generic[DataType,Unpack[Ts]]Data type for a skip_if predicate.
- format_perf_counter(start: float, end: float | None = None) str[source]#
Deprecated alias of
rics.strings.format_perf_counter().
- format_seconds(t: float, *, allow_negative: bool = False) str[source]#
Deprecated alias of
rics.strings.format_seconds().
- get_best(run_results: dict[str, dict[Hashable, list[float]]] | DataFrame, per_candidate: bool = False, names: Iterable[str] = ()) DataFrame[source]#
Get a summarized view of the best run results for each candidate/data pair.
- Parameters:
run_results – Output of
rics.performance.MultiCaseTimer.run().per_candidate – If
True, show the best times for all candidate/data pairs. Otherwise, just show the best candidate per data label.names – Data label columns to show. Use single ‘Test data’ column if not given.
- Returns:
The best (lowest) times for each candidate/data pair.
- legacy_plot_run(run_results: dict[str, dict[Hashable, list[float]]] | DataFrame, x: Literal['candidate', 'data'] | None = None, unit: Literal['s', 'ms', 'μs', 'us', 'ns'] | None = None, **kwargs: Any) None[source]#
Plot the results of a performance test.
This is a legacy method that does not support facets.
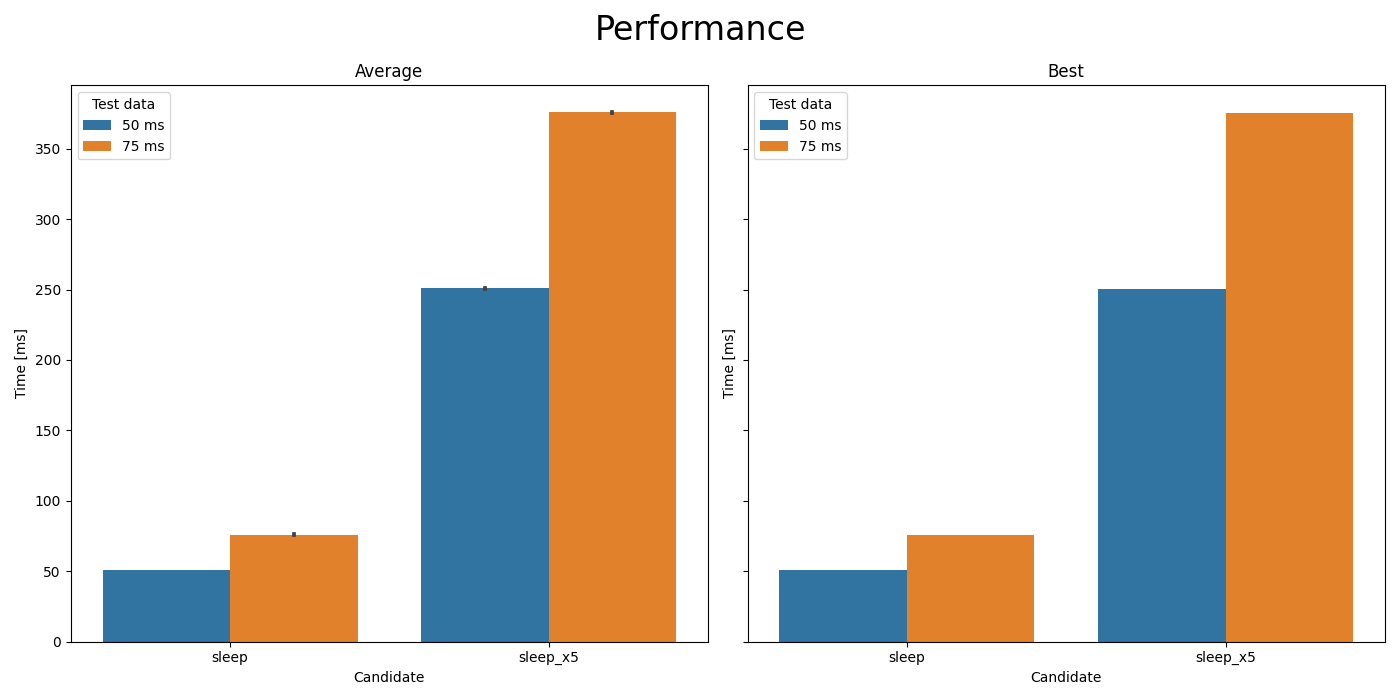
Comparison of
time.sleep(t)andtime.sleep(5*t).#- Parameters:
run_results – Output of
rics.performance.MultiCaseTimer.run().x – The value to plot on the X-axis, using the other to determine hue. Default=derive.
unit – Time unit to plot on the Y-axis. Default=derive.
**kwargs – Keyword arguments for
seaborn.barplot().
- Raises:
ModuleNotFoundError – If Seaborn isn’t installed.
TypeError – For unknown unit arguments.
- plot_run(run_results: dict[str, dict[Hashable, list[float]]] | DataFrame, *, x: Literal['candidate', 'data'] | None = None, horizontal: bool = False, unit: Literal['s', 'ms', 'μs', 'us', 'ns'] | None = None, kind: Literal['bar', 'box', 'boxen', 'point', 'strip', 'swarm', 'violin'] = 'bar', names: Iterable[str] = (), **kwargs: Any) seaborn.FacetGrid[source]#
Create a
seaborn.catplot()from run results.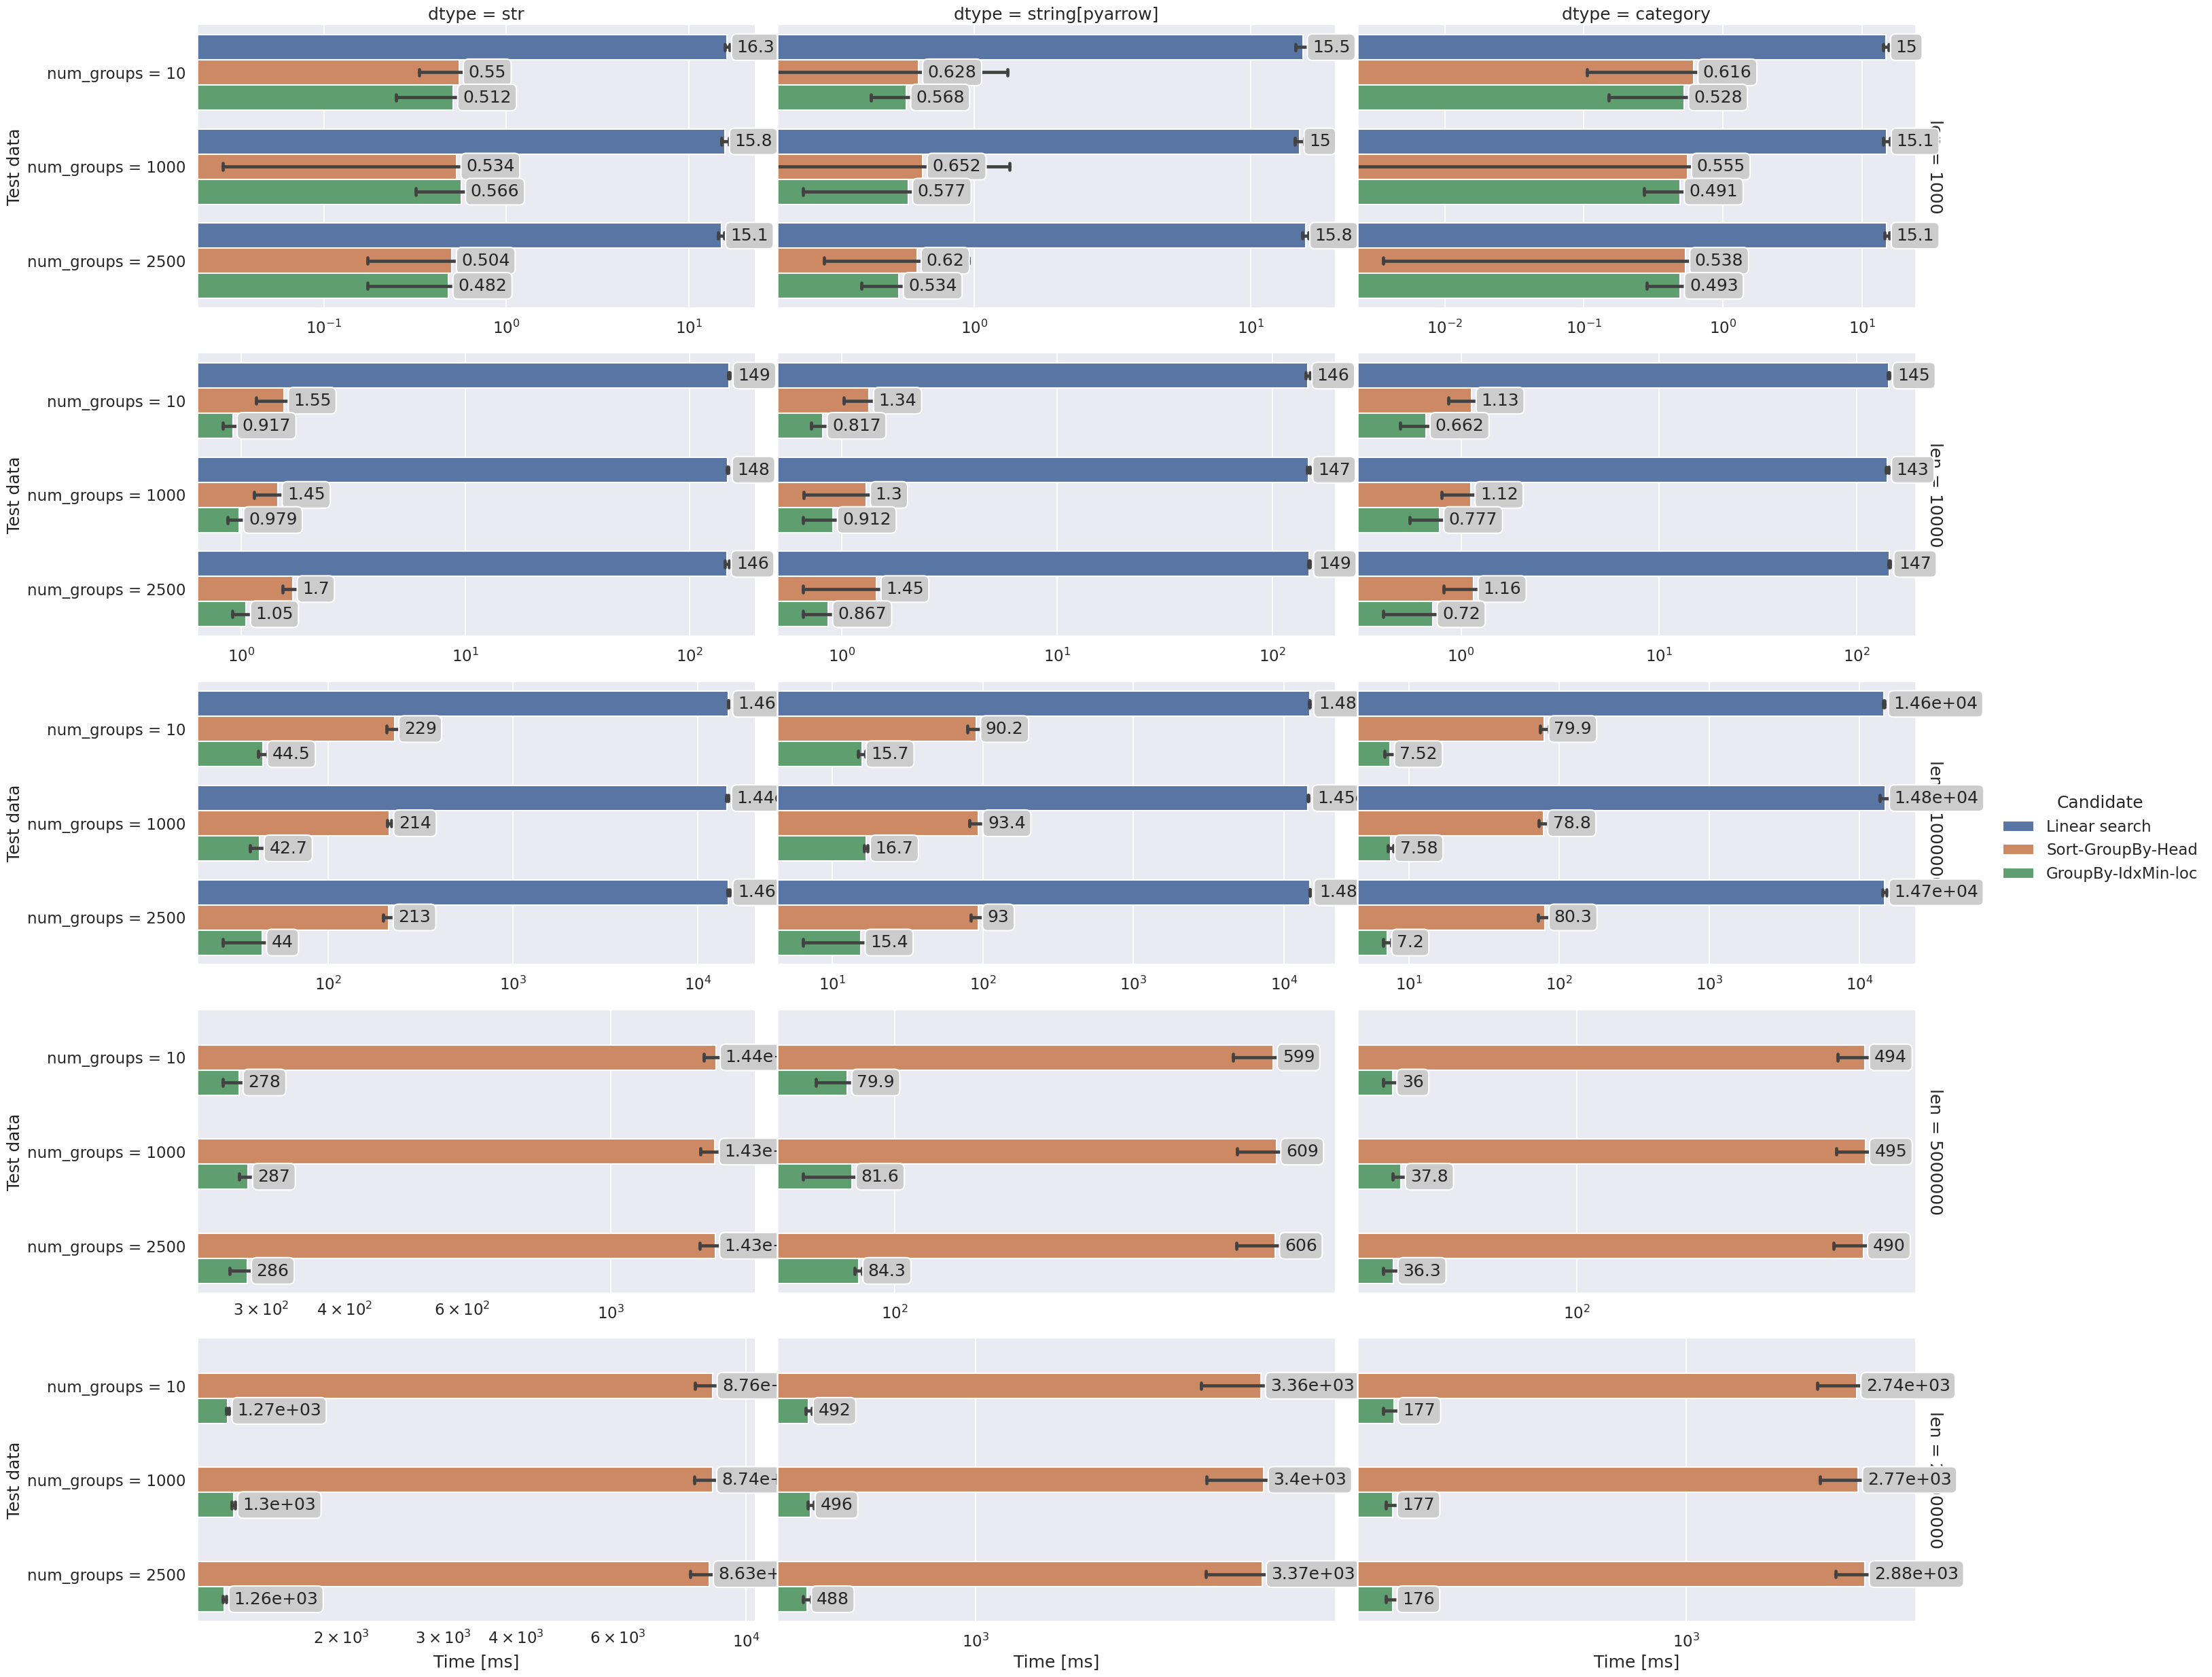
Comparison of best-per-group selection functions (from the examples page).#
- The names argument:
Names may be passed in combination with
rowand/orcolarguments to add facets to theseaborn.catplot(). If given, the keys in the test data must be of typetuplewith the same length as names. For example, if your test data looks like this:test_data = { ("+", 2, 5): +(2**5), ("+", 9, 5): +(9**5), ("+", 10, 5): +(10**5), ("-", 10, 3): -(10**3), ("-", 5, 3): -(5**3), }
you may pass
plot_run(
    run_results = ...,
    names=["sign", "base", "exponent"],
    col="sign",
    row="exponent",
)
to plot each sign/exponent in a separate facet, comparing only the exponents in the subplots.
- Parameters:
run_results – Output of
MultiCaseTimer.run().x – X-axis quantity;
candidate'or'data'. The other will be used as the hue.horizontal – If
True, plot timings on the X-axis instead. The x becomes the new Y-axis quantity.unit – Y-axis time
Unit.kind – The
Kindof plot to draw.names – Test data level names.
**kwargs – Keyword arguments for
seaborn.catplot().
- Returns:
- Raises:
ModuleNotFoundError – If Seaborn isn’t installed.
TypeError – For unknown unit arguments.
- run_multivariate_test(candidate_method: Mapping[str, Callable[[DataType], Any]] | Collection[Callable[[DataType], Any]] | Callable[[DataType], Any], test_data: Mapping[Any, DataType] | Collection[DataType] | Callable[[Unpack[Ts]], DataType], *, time_per_candidate: float = 6.0, plot: bool = True, show: bool = True, names: Iterable[str] | None = (), progress: bool = False, case_args: Collection[tuple[Unpack[Ts]]] | None = None, kwargs: Any | None = None, **plot_kwargs: Any) DataFrame[source]#
Run performance tests for multiple candidate methods on collections of test data.
This is a convenience method which combines
MultiCaseTimer.run(),to_dataframe()and – if plotting is enabled –plot_run(). For full functionally these methods should be use directly.- Parameters:
candidate_method – A single method, collection of functions or a dict {label: function} of candidates.
test_data – A single datum, or a dict
{label: data}to evaluate candidates on.time_per_candidate – Desired runtime for each repetition per candidate label.
plot – If
True, plot a figure usingplot_run().show – If
True, attempt to display the figure. Ignored whenplot=False.names – Level names for tuple keys in the data (creates new columns). See
plot_run()for details. Set toNoneto disable derived names when test_data is callable.progress – If
True, display a progress bar. Requirestqdm.case_args – These are positional arguments for the test_data callable.
kwargs – Shared keyword arguments for the test_data callable.
**plot_kwargs – See
plot_run()for details. Ignored ifplot=False.
- Returns:
A long-format DataFrame of results.
- Raises:
ModuleNotFoundError – If Seaborn isn’t installed and
plot=True.TypeError – If args or kwargs are set when test_data is not a callable.
ValueError – If args is empty and test_data is a callable.
See also
The
plot_run()andget_best()functions.
- to_dataframe(run_results: dict[str, dict[Hashable, list[float]]], names: Iterable[str] = ()) DataFrame[source]#
Create a DataFrame from performance run output, adding derived values.
- Parameters:
run_results – A dict run_results on the form
{candidate_label: {data_label: [runtime, ...]}}, returned byrics.performance.MultiCaseTimer.run().names – Level names for tuple keys in the data (creates new columns). See
plot_run()for details.
- Returns:
The run_result input as a DataFrame.
Modules
Multivariate performance testing from the command line. |
|
Types used by the plotting framework. |
|
Types used by the framework. |