rics.plotting#
Plotting utility methods.
Functions
Call all configure-functions in this module. |
|
Configure Matplotlib figure plotting. |
|
Configure Seaborn figure plotting. |
|
|
Decorate an axis by formatting ticks as percentages. |
|
Decorate an axis by setting the labels to multiples of pi. |
Classes
|
Protocol class indicating something that as an X-axis. |
|
Protocol class indicating something that as an Y-axis. |
- class HasXAxis(*args, **kwargs)[source]#
Bases:
ProtocolProtocol class indicating something that as an X-axis.
- class HasYAxis(*args, **kwargs)[source]#
Bases:
ProtocolProtocol class indicating something that as an Y-axis.
- configure_seaborn() None[source]#
Configure Seaborn figure plotting.
Caveat Emptor: May do strange stuff 👻.
- Raises:
ModuleNotFoundError – If Seaborn is not installed.
- configure_matplotlib() None[source]#
Configure Matplotlib figure plotting.
Caveat Emptor: May do strange stuff 👻.
- Raises:
ModuleNotFoundError – If matplotlib is not installed.
- pi_ticks(ax: Axis | HasXAxis, half_rep: Literal['fraction', 'f', 'decimal', 'd'] | None = None) None[source]#
Decorate an axis by setting the labels to multiples of pi.
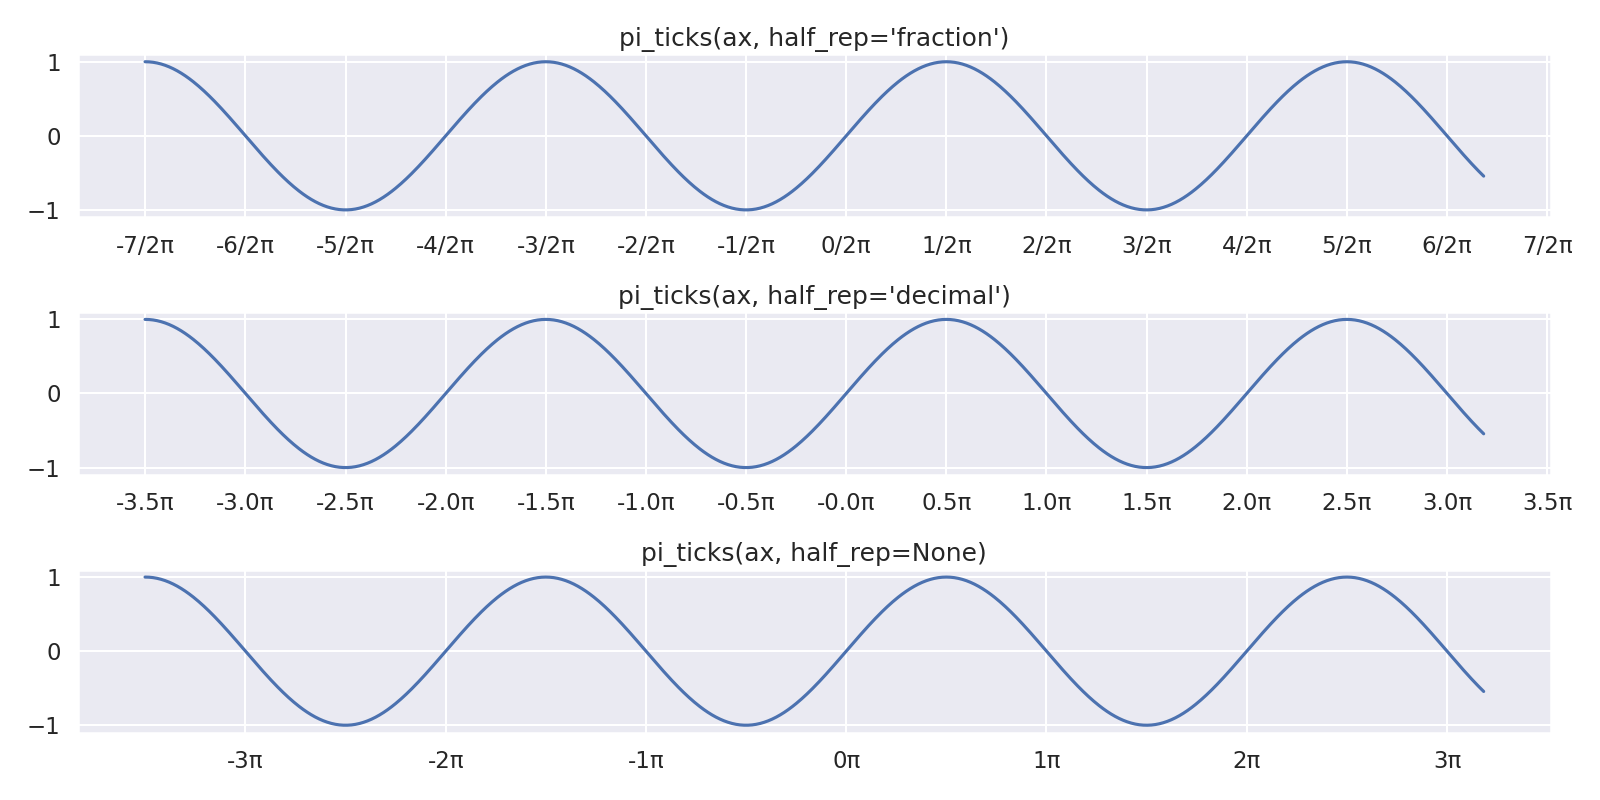
Options for the half_rep argument.# Value
Interpretation
Example output
NoneShow integer multiples only.
0, π, 2π, 3π, …
‘f’ or ‘fraction’
Halves of π use fractional representation.
0/2π, 1/2π, 2/2π, 3/2π, …
‘d’ or ‘decimal’
Halves of π use decimal representation.
0.0π, 0.5π, 1.0π, 1.5π, …
- Parameters:
ax – An axis to decorate, or an object with an xaxis attribute.
half_rep – Controls how fractions of π are represented on the x-axis.
- percentage_ticks(ax: Axis | HasYAxis, *, sign: bool = False, decimals: int | Literal[False] | None = 1) None[source]#
Decorate an axis by formatting ticks as percentages.
- Parameters:
ax – An axis to decorate, or an object with a yaxis attribute.
sign – If
True, show prepend ‘+’ for positive ticks.decimals – Number of decimals to keep.
- Returns:
The formatting string.